During this coronavirus pandemic, everyone should be familiar with the need to flatten the curve on the pandemic – a term that describes efforts to bring down the peak of infected cases and to spread out the impacts so that healthcare can be sustained over time without being overwhelmed.
Can we use this popular term “flatten the curve” to describe waste generation in Singapore? As there are differences between the pandemic and waste curve, we will adapt and use “flattening the curve” as a framing concept to mean two things: a peaking of the waste generation curve and at least 5 years of waste generation numbers lower than the peak.
As we flatten the curve on waste generation in Singapore, we should see a peak and lower amounts of waste generated over time, which would require efforts to reduce, reuse and recycle “waste” resources, and shift towards circular economy models of production and consumption.
The figure below shows the total waste generated, waste recycled, and waste disposed from 2000 to 2019 in Singapore (waste statistics derived from NEA and reports). Waste disposed is the amount of waste sent to the waste-to-energy plants and the Semakau Landfill, while waste recycled is the amount of waste recycled locally or exported for recycling. Waste generated is the sum of the waste disposed and recycled, and refers to the total waste output for Singapore.
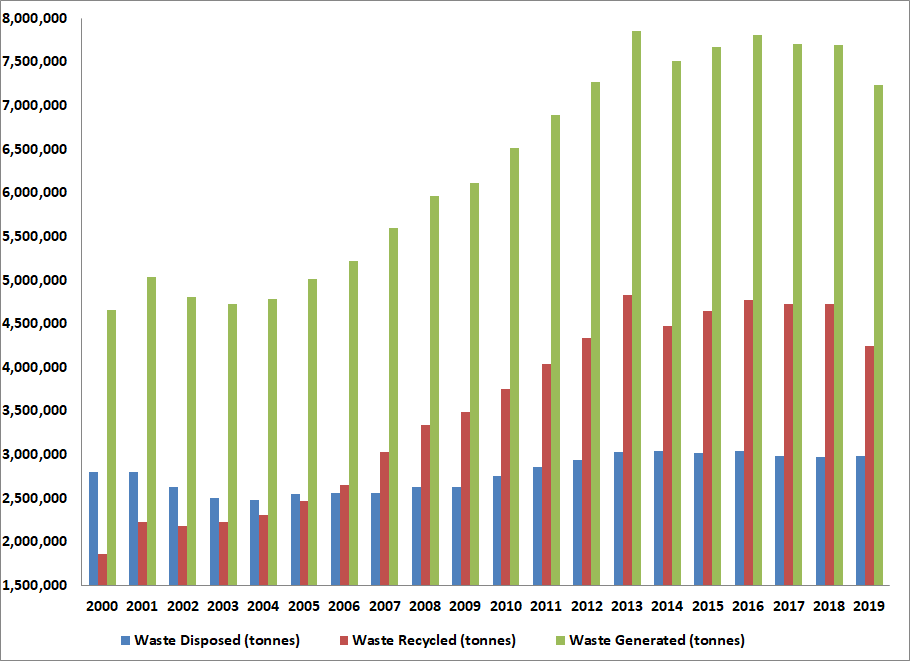
Looking at the total waste generated numbers over time, it is obvious that we have flatten the curve on waste generation in Singapore. Waste generation reached a peak of 7,851,500 tonnes in 2013, and has 6 years of lower numbers after the peak. There is a 8% reduction in the amount of waste generated from the peak in 2013 to the amount of 7,234,000 tonnes last year.
Due to the stricter circuit breaker period where non-essential activities are stopped, and the closure of the travel and hospitality industries, we are likely to see much lower business and economic outputs in Singapore and thus further reduction in waste generation as a whole for 2020. There could be a substantial increase in the generation of hospital waste and plastic disposables in 2020, but this is likely to be offset by the overall slower economic activities.
How has Singapore flatten the curve on waste generation? Let’s look at the top 5 waste types in Singapore for 2019 and see how each waste type contribute to flattening the curve.
1. Construction and Demolition Waste
Construction and demolition (C&D) waste are the largest contributor to the total waste generated in Singapore, about 20% of total waste. The figure below shows that we have flatten the curve on C&D waste generation in Singapore. Waste generation reached a peak of 1,695,300 tonnes in 2013, and has 6 years of lower numbers after the peak. There is a 15% reduction in the amount of waste generated from the peak in 2013 to the amount of 1,440,000 tonnes last year.
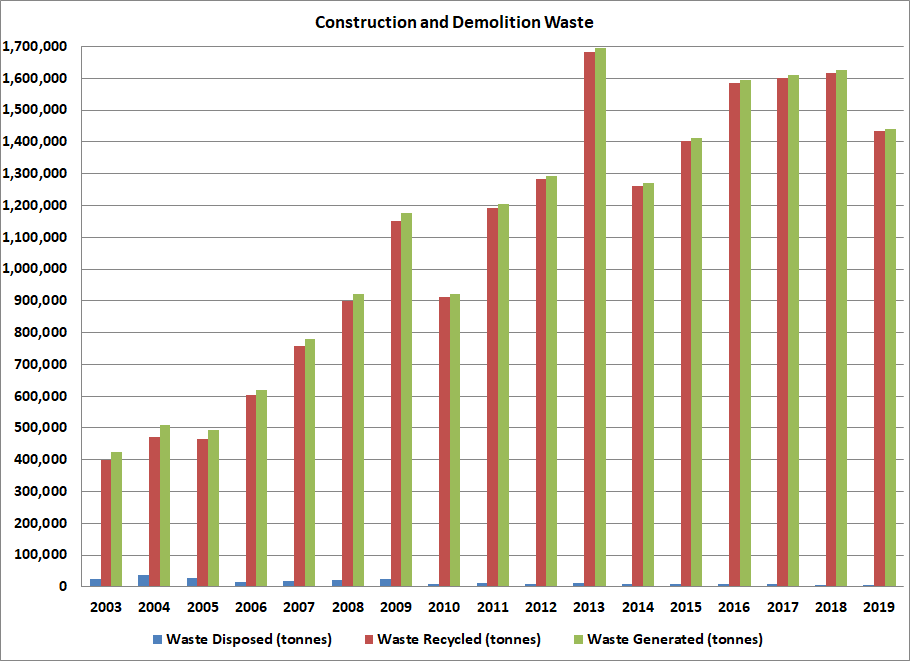
Singapore has managed to flatten the curve for construction and demolition waste, perhaps through a combination of more sustainable buildings, construction methods, and prefabrication of components leading to less construction waste; and property cooling measures leading to less construction activities. Almost all the C&D waste in Singapore are recycled, with a 99% recycling rate in 2019, so this waste stream is not a problem for Singapore. However, there are still opportunities to further reduce the C&D waste generation through circular economy approaches for the built environment such as designing buildings for deconstruction, or developing a marketplace for used and reclaimed construction materials.
2. Ferrous Metal
Ferrous metal contribute about 18% to the total waste generated in Singapore. The figure below shows that we have flatten the curve on ferrous metal waste generation in Singapore. Waste generation reached a peak of 1,445,900 tonnes in 2014, and has 5 years of lower numbers after the peak. There is a 12% reduction in the amount of waste generated from the peak in 2014 to the amount of 1,278,000 tonnes last year.
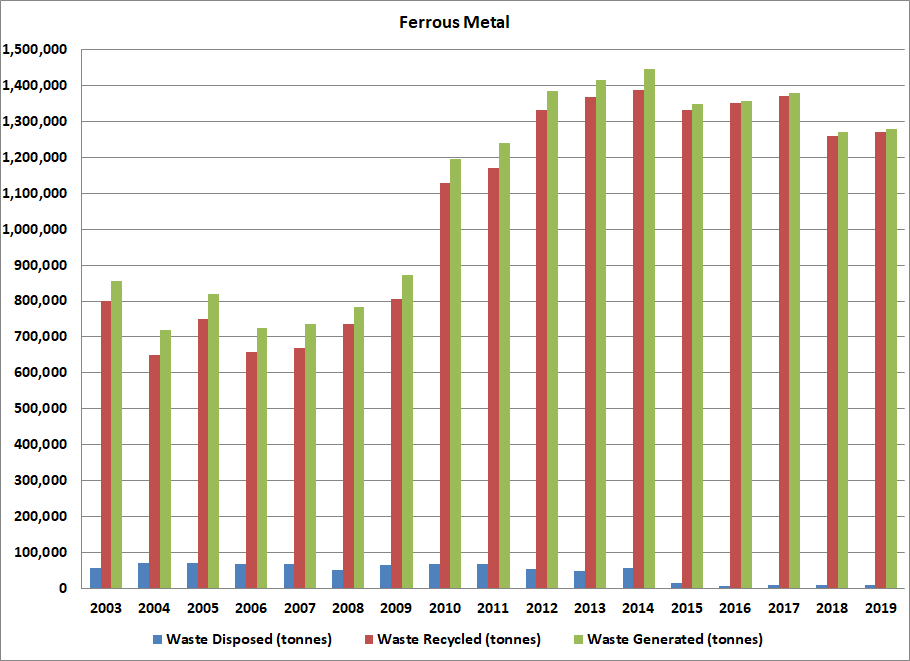
Singapore has managed to flatten the curve for ferrous metal waste, perhaps through a combination of more products using plastic packaging rather than using metal; and less construction activities due to the property cooling measures. Almost all the ferrous metal waste in Singapore are recycled, with a 99% recycling rate in 2019, so this waste stream is not a problem for Singapore.
3. Paper/Cardboard
Paper and cardboard contribute about 14% to the total waste generated in Singapore. The figure below shows that we have flatten the curve on paper waste generation in Singapore. Waste generation reached a peak of 1,383,900 tonnes in 2010, and has 9 years of lower numbers after the peak. There is a 27% reduction in the amount of waste generated from the peak in 2010 to the amount of 1,011,000 tonnes last year.
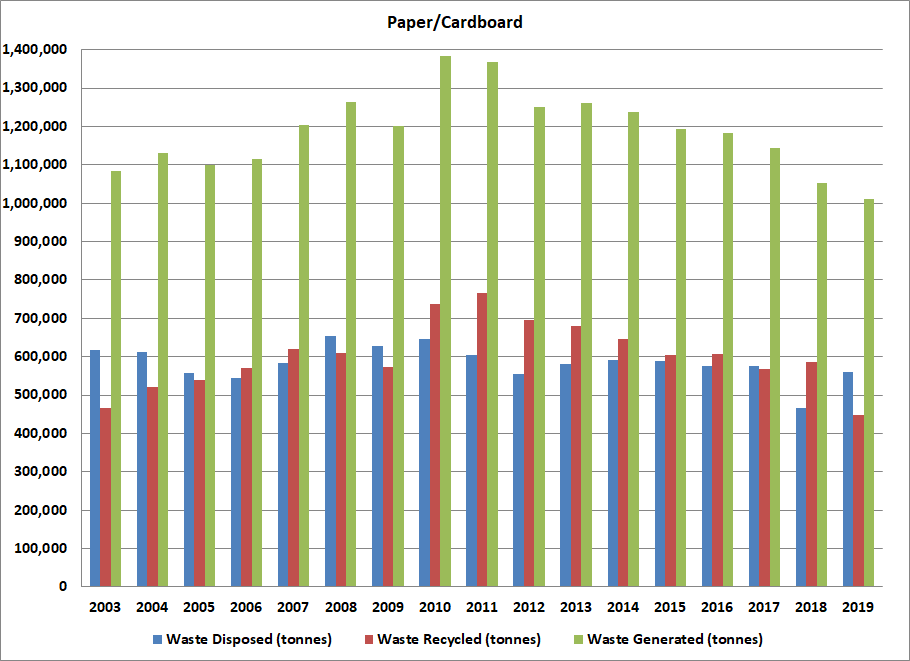
Singapore has managed to flatten the curve for paper waste, perhaps because of the overall trend of digitalisation where people go online and paperless, and consume more digital products rather than print newspapers and magazines. Less than half of the paper and carboard waste generated in Singapore are recycled, with a 44% recycling rate in 2019, so this waste stream is a problem for Singapore. There are still opportunities to further reduce the generation of paper waste by switching to more online options over paper, and to recycle more paper waste through better education and engagement activities. However, the current market for paper collection and recycling is not favourable due to the import ban by China.
4. Plastics
Plastics contribute about 13% to the total waste generated in Singapore. The figure below shows that we have not flatten the curve on plastic waste generation in Singapore. Waste generation is still increasing over the years and might have peaked at 949,300 tonnes in 2018, but we still need to look at the next few years to see if there are further reductions.
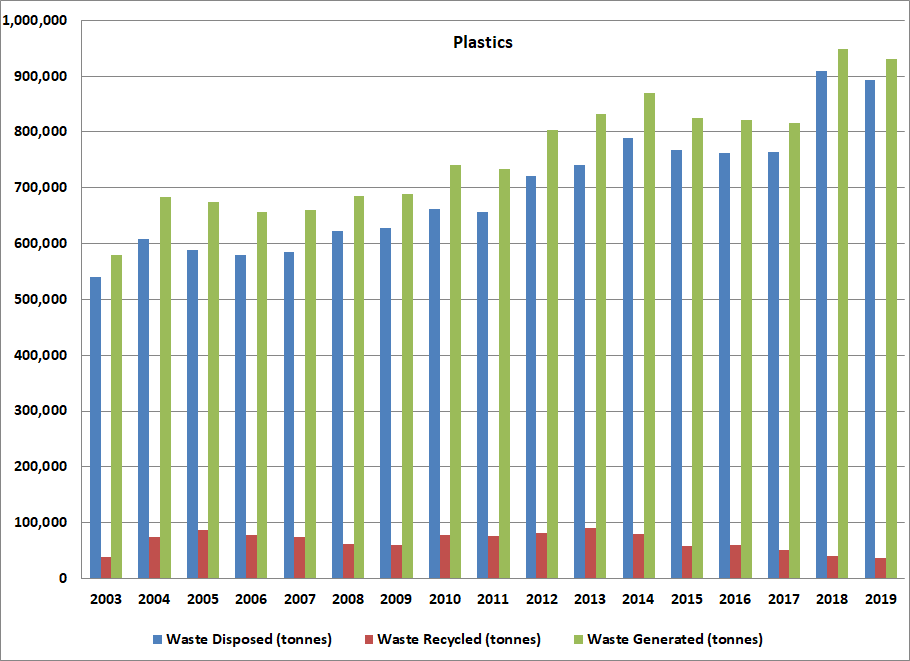
Singapore has not managed to flatten the curve for plastic waste and only 4% of plastic waste is recycled in Singapore, so this waste stream is a big problem for Singapore. More efforts are needed to reduce the consumption of single-use plastic disposables such as plastic bags, disposable cups, plates and utensils, and bottled water, and also for manufacturers to reduce excessive plastic packaging for products. Packaging is one of the priority waste streams under MEWR’s Zero Waste Masterplan, which includes various strategies to tackle packaging waste such as mandatory reporting of packaging data and 3R (Reduce, Reuse, Recycle) plans for packaging.
5. Food Waste
Food waste contribute about 10% to the total waste generated in Singapore. The figure below shows that we have not flatten the curve on food waste generation in Singapore. Waste generation might have peaked at 809,800 tonnes in 2017, but we still need to look at the next few years to see if there are further reductions.
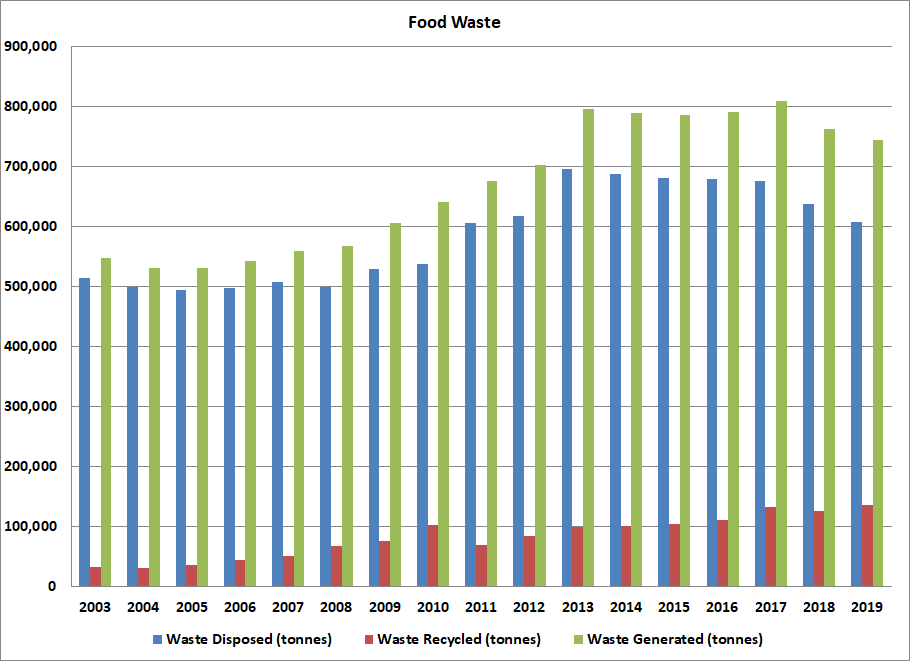
Singapore has not managed to flatten the curve for food waste and only 18% of food waste is recycled in Singapore, so this waste stream is a big problem for Singapore. More efforts are needed to reduce food waste generation through better education and engagement activities, introduction of legislation on excess food redistribution, and greater acceptance of “ugly food”. Food waste is one of the priority waste streams under MEWR’s Zero Waste Masterplan, which includes various strategies to tackle food waste such as mandating large commercial and industrial food waste generators to segregate and recycle their food waste.
Singapore has managed to flatten the curve on total waste generation, and also for waste streams such as construction and demolition waste, ferrous metal, paper and cardboard, but there are still gaps in tackling plastics and food waste. More efforts are required to flatten the curve for these two persistent waste streams.

Dear Editor / Writer
I have a press release on an announcement regarding renewable energy from an SGX (Singapore Exchange) subsidiary. Please provide me with the name and email of the editor so I can send the announcement details. Thank you very much!